服务器稳定性及基准测试方法
重要更新: 2025-11-4 硬盘测试开发了全自动测试工具,见下方硬盘测试部分
测试项
测试前准备
CPU调优
BIOS关闭超线程
方法:
BIOS里找CPU或者Socket Configuration,进入其中,找Processor Configuration,
进入其中关闭超线程即可
超线程在BIOS的写法通常有:
- SMT
- Logical Processor(LP)
- Hyper-Threading
理由:
超线程的作用是让 CPU 能在一个线程等待(例如等待内存I/O)时,利用空闲执行单元去执行另一个线程。
所以对于CPU性能测试的浮点运算、以及CPU满载的业务场景,超线程导致的线程切换,反而会:
增加上下文切换与调度开销(Scheduler Overhead)
- 操作系统调度器看到两个逻辑核心,调度两个重量级任务上去,但实际上底层的物理核根本没法承担
导致缓存污染(Cache Pollution)
- 不同线程使用的数据不同,缓存反而会互相驱逐对方数据
- 这个问题与下文中根据L3缓存设计NB大小尤其相关
BIOS关闭C-State
方法:
BIOS里找CPU或者Socket Configuration,进入其中,找Advanced Power Management Configuration,
进入其中CPU C State Control,参数如下:
| 参数 | 解释 | 建议设置 |
|---|---|---|
| Enable Monitor MWAIT | 是否允许使用 MWAIT 指令进入 C-state | Disabled |
| CPU C6 report | 是否让操作系统知道 C6 可用 | Disabled |
| Enhanced Halt State (C1E) | 启用增强型省电停机(降压降频) | Disabled |
| OS ACPI Cx | 操作系统可用的最深 C 状态(如 ACPI C2) | 设置为能选的最小值 |
补充:
上面是比较通用的写法,但我看到Lenovo写的是SST-PP……自行判断或者问下厂商吧
原理就是C-State设置0最好,就像Lenovo的SST-PP,BIOS里也写了,Level 0 TDP 185W,最高性能

理由:
C-State是省电休眠状态控制,除非你要省电,否则把它关了。
让性能最高,减少CPU状态切换导致的延迟,关不了就保持在C0使CPU始终活跃。
存储调优
RAID调优
Stripe Size(带宽): 1m
写入策略: Write Back(回写)
驱动器缓存: Drive Cache disabled(关闭磁盘缓存)
初始化方式: Fast Initialize(快速初始化)
文件系统调优
采用parted分区,gpt
分区从2048s扇区起,保持4k对齐
文件系统采用xfs即可
CPU基准测试
| 测试项 | 测试工具 | 参考业务场景 | 测试方式 |
|---|---|---|---|
| 双精度浮点运算 float64 | HPL | 该项测试为HPC行业标准,TOP500超级计算机排行榜均采用该方式评估 | 测试3次取均值 |
内存基准测试
| 测试项 | 测试工具 | 选择理由 | 测试方式 |
|---|---|---|---|
| 内存带宽 | STREAM Benchmark | HPC内存带宽的行业标准测试,TOP500超级计算机排行榜均采用该方式评估 | Copy/Scale/Add/Triad测试3次取均值 |
硬盘测试
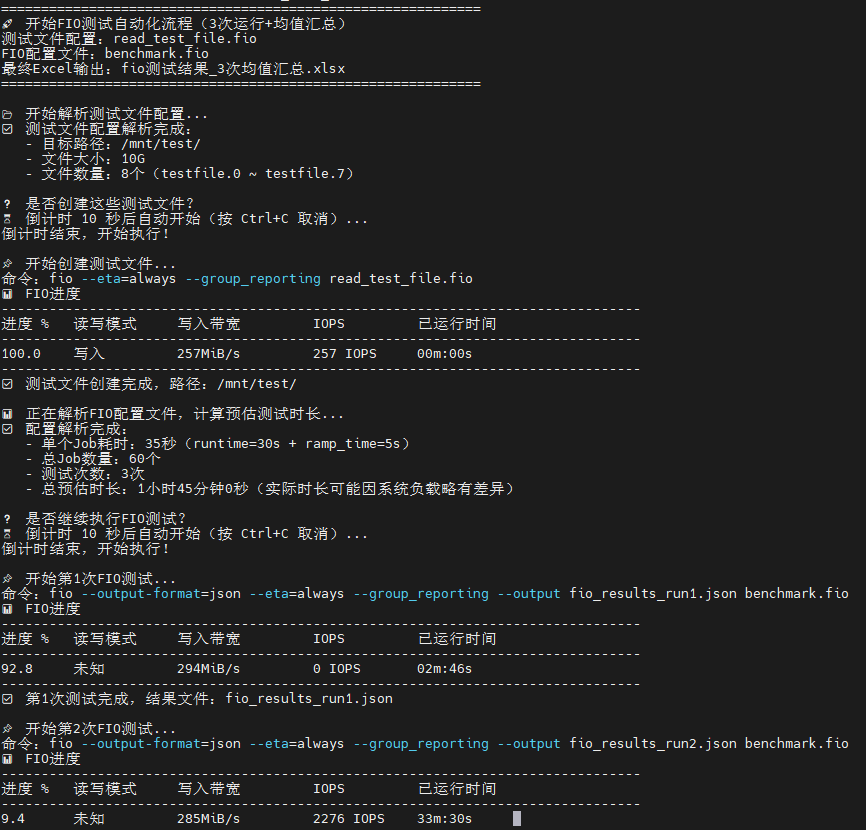
重要更新: 2025-11-5 发布了v1.1版本,修复了读测试无IO导致测试结果失真的BUG
新增了实时显示FIO进度的功能
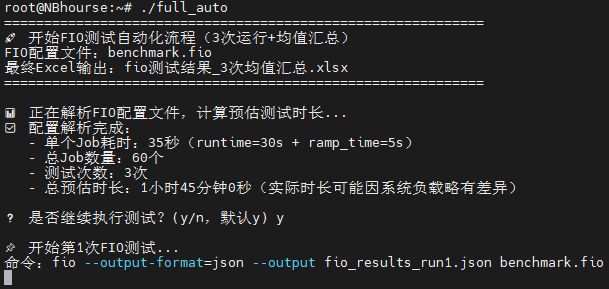
重要更新: 2025-11-4 发布了fio硬盘测试的全自动工具
工具涵盖了自动运行fio,通过预置的benchmark.fio文件自动运行60项基础测试
运行前检查其中的directory=/mnt/test/ ; 测试目录路径,请根据实际情况修改
补充:注意directory=后面一定是带/的,因为是目录
可以选择将需要测试的硬盘挂载到这个目录,或者修改为你想要的目录runtime=30s ; 每个测试运行 30 秒,则是每项测试运行多久ramp_time=5s ; 5秒预热,使设备进入稳定状态,这一条无需修改,作用是按照所设定的参数运行5秒确保硬盘跑起来,避免冷启动的性能过低或者波动size=10G,这是测试文件的大小,注意根据你的容量并计算numjobs的数量,例如8个numjobs则是10G*8=80G硬盘空间
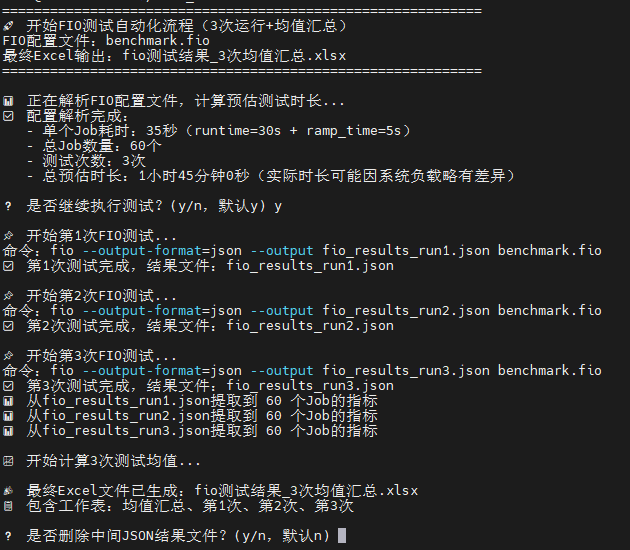
给full_auto设置执行权限,并确保benchmark.fio和该程序在一个目录即可
运行完成后会在当前目录生成原始数据的json文件和导出可读的xlsxExcel表格
仓库地址:https://github.com/1949hacker/fio_benchmark
| 测试项 | 测试工具 | 参考业务场景 | 测试方式 |
|---|---|---|---|
| 4k单队列 | fio bs=4k iodepth=1 | MySQL场景 | 测试3次取均值 |
| 4k 32队列 | fio bs=4k iodepth=32 | MongoDB场景 | 测试3次取均值 |
| 32k 32队列 | fio bs=32k iodepth=32 | 高并发Web服务,Kafka日志刷盘,多线程缓存写入 | 测试3次取均值 |
| 1m 单队列 | fio bs=1m iodepth=1 | 顺序读写,备份、视频流、镜像分发 | 测试3次取均值 |
| 1m 32队列 | fio bs=1m iodepth=32 | 并发大文件读写,大规模备份,分布式存储,对象存储 | 测试3次取均值 |
| 硬盘压测 | fio -numjobs=32 -bs=4k -iodepth=64 -directory | 具体代码见下方及下文中有关于fio参数的解释 |
补充说明:除系统盘不能直接测试裸盘外,其他盘均应使用裸盘测试,如
fio -filename=/dev/sdb和fio -filename=/dev/nvme0n1,直接指向硬盘块设备,而不是分区或路径
1 | fio -name=disk_benchmark -size=5G -runtime=5d -time_base -direct=1 -ioengine=libaio -randrepeat=0 -numjobs=32 -group_reporting -bs=4k -rw=randrw -rwmixwrite=30 -directory=/home/test/ -iodepth=64 |
其中针对业务场景,根据单台服务器部署的业务数量适当设置numjobs以模拟操作系统/应用层并发。
例如单台服务器4个数据库,则fio bs=4k iodepth=32 numjobs=4。
iodepth对应单个线程的队列深度,用于存储设备并发能力测试
numjobs对应多个线程并发,用于测试操作系统/应用层并发能力
综合基准测试
| 测试项 | 测试工具 | 参考业务场景 | 测试方式 |
|---|---|---|---|
| 综合性能指数 | GeekBench | 横向比较整机性能,仅供参考 | 普通测试 |
CentOS 7.9.2009跑不了GeekBench 6
测试过程
AMD 9F14平台测试
补充:
可以先准备好fio程序的目录/root/fio
编译好hpl文件并确保目录是/root/hpl
编译好内存测试的stream并放在/root/memtest
当然,目录自由发挥也可以,改下方代码即可
1 | 一行代码搞定内存基准、CPU基准、存储基准的全自动测试 |
安装CentOS 7.9.2009
替换源为清华大学CentOS-Vault源
在清华CentOS-Vault仓库输入小版本,获取命令
例如CentOS 7.9.2009如下
1 | sed -e "s|^mirrorlist=|#mirrorlist=|g" \ |
该命令执行后会将原本的所有源配置文件备份为带.bak后缀名的备份
可以通过下方的命令快速还原
1 | 启用bash扩展通配符 |
yum makecache更新源
yum install vim安装vim编辑器
1 | 更新源 |
准备CPU的Linpack测试
1 | 基础环境 |
HPL.dat的参数及其说明
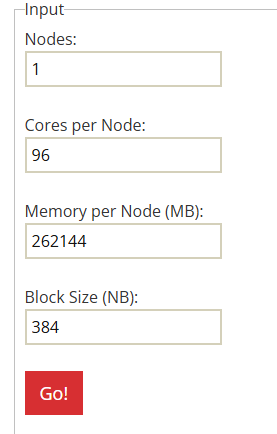
在线生成HPL.dat文件的网站 HPL.dat
| 参数 | 说明 |
|---|---|
| Nodes | 对应CPU数量 |
| Cores per Node | 每个CPU多少核 |
| Memory per Node(MB) | 每个CPU有多少MB内存 |
| Block Size(NB) | HPL运算的块大小 |
NB 块大小计算方式:
设置适当的块大小,使数据块能够很好的放入CPU的高速缓存(L2/L3 Cache),如果数据块不能放入高速缓存,则不得不从慢得多的主内存RAM中进行读取,从而导致性能瓶颈。
NB最好是PQ的整数倍,以我的AMD 9A14为例,L3为384MB,96核心
HPL将矩阵N分块成NB*NB的小块,然后分布在一个二维进程网格P行Q列上
所以如果任何一方过长,就会造成通信路径变长,从而导致性能开销大
为了使性能达到最优,需要使这个二维网格接近正方形,也就是PQ值相近,且同时P*Q需要等于核心数,以确保每个核心都有数据块在计算
PQ计算公式
使用在线生成则直接跳过此处即可,仅用作学习
1 | 根据内核数量取近似的能开方的整数 |
NB块大小计算公式
1 | 首先查询CPU的L3缓存 |
最终计算出NB为384
注意其中Nodes填的是有多少个CPUCores per Node则是每个CPU有多少物理内核Memory per Node(MB)是每个CPU有多少内存可用,所以内存条也需要均匀安装Block Size(NB)则是填入上方计算的值
在线生成后的HPL.dat如下,HPL只会读取第一列,数字后方的是注释,带#的也是注释
1 | HPLinpack benchmark input file |
根据这份文件,运行命令如下:
1 | mpirun --allow-run-as-root -np 96 --map-by core --bind-to core ./xhpl |
关于参数的解释在官网有详细说明HPL Tuning
进行内存的基准测试
使用STREAM Benchmark进行测试
1 | 安装编译工具 |
输出结果如下,只需要第30行中Triad的带宽212674.9MB/s和延迟的平均值Avg time
1 | ------------------------------------------------------------- |
只取其中的典型值Triad即可,代表典型科学计算/数值模拟中的内存访问性能
硬盘性能fio测试
使用fio进行硬盘的性能测试,测试结果包含IOPS、带宽、延迟
1 | 安装fio |
综合性能测试
使用CentOS 7.9.2009和GeekBench进行综合性能评估
下载地址 geekbench
1 | 解压下载的压缩包 |
稳定性测试
鉴于HPL测试本身就会使服务器CPU内存满载,所以直接在上文CPU测试的基础上直接变成重复执行即可做到稳定性测试,配合带外观察CPU温度内存等是否故障即可
1 | 循环运行100次 |
使用该脚本运行并将运行结果也进行统计,方便同时观察性能是否有波动
1 | for i in {1..1000}; do |